如何在matplotlib中使用pyplot模块设置标题
这期内容当中小编将会给大家带来有关如何在matplotlib中使用pyplot模块设置标题,文章内容丰富且以专业的角度为大家分析和叙述,阅读完这篇文章希望大家可以有所收获。
使用title()设置子图标题
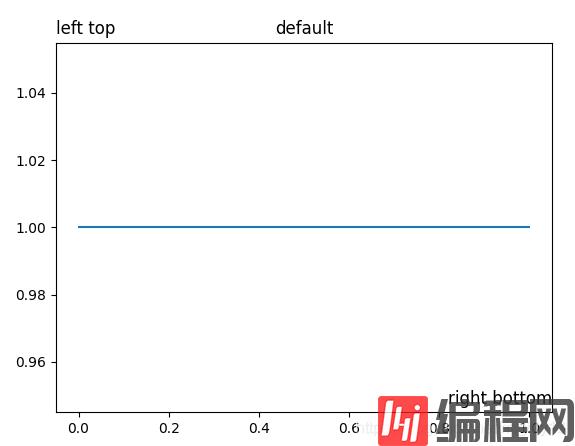
title()可同时在子图中显示中间、左侧、右侧3个标题。
函数签名为matplotlib.pyplot.title(label, fontdict=None, loc=None, pad=None, *, y=None, **kwargs)
参数作用及取值如下:
label:类型为字符串,即标题文本。fontdict:类型为字典,控制文本的字体属性。默认值为:
{'fontsize': rcParams['axes.titlesize'], 'fontweight': rcParams['axes.titleweight'], 'color': rcParams['axes.titlecolor'], 'verticalalignment': 'baseline', 'horizontalalignment': loc}loc:取值范围为{'left', 'center', 'right'},默认值为rcParams["axes.titlelocation"]('center'),即标题的位置。y:类型为浮点数,默认值为rcParams["axes.titley"] (None)。即标题在子图中的垂直距离,单位为子图高度的百分比,1.0在子图最顶部,默认值None则自动确定标题位置,避免与其他元素重叠。pad:类型为浮点数,默认值为default: rcParams["axes.titlepad"] (6.0)。即标题与子图的填充距离(内边距)。**kwargs:Text对象关键字属性,用于控制文本的外观属性,如字体、文本颜色等。
返回值为Text对象。
title()相关rcParams为:
#axes.titlelocation: center # alignment of the title: {left, right, center}#axes.titlesize: large # fontsize of the axes title#axes.titleweight: normal # font weight of title#axes.titlecolor: auto # color of the axes title, auto falls back to # text.color as default value#axes.titley: None # position title (axes relative units). None implies auto#axes.titlepad: 6.0 # pad between axes and title in points底层相关方法为:Axes.set_title(self, label, fontdict=None, loc=None, pad=None, *, y=None, **kwargs)Axes.get_title(self, loc='center'):注意返回指定位置的标题文本。
案例
同时设置3个子图标题。
import matplotlib.pyplot as plt# 注意,子图可以同时设置中间、左侧、右侧3个标题plt.plot([1, 1])# 在右侧底部显示子图标题plt.title("right bottom",y=0,loc='right')# 在左侧顶部显示子图标题plt.title("left top",y=1,loc='left')# 显示默认子图标题plt.title("default")plt.show()
使用suptitle()设置图像标题
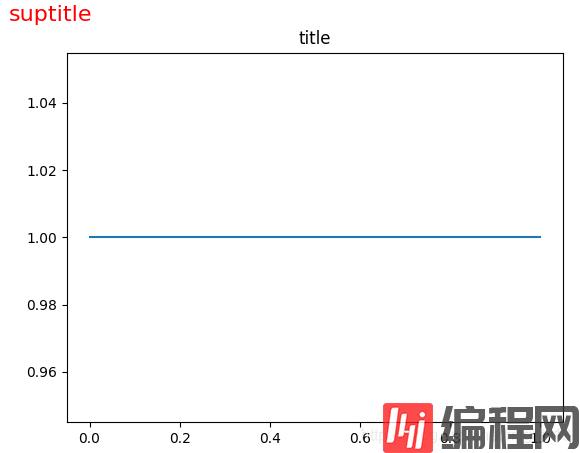
为图像添加一个居中标题。
函数签名为matplotlib.pyplot.suptitle(t, **kwargs)
参数作用及取值如下:
t:类型为字符串,即标题文本。x:类型为浮点数,即标题在图像水平方向相对位置,默认值为0.5。y:类型为浮点数,即标题在图像垂直方向相对位置,默认值为0.98。fontdict:类型为字典,控制文本的字体属性。默认值为:
{'fontsize': rcParams['axes.titlesize'], 'fontweight': rcParams['axes.titleweight'], 'color': rcParams['axes.titlecolor'], 'verticalalignment': 'baseline', 'horizontalalignment': loc}horizontalalignment, ha:类型为字符串,取值范围{'center', 'left', right'},默认值为'center',即相对于(x,y)的水平方向对齐方式。verticalalignment, va:类型为字符串,取值范围{'top', 'center', 'bottom', 'baseline'},默认值为'top',即相对于(x,y)的垂直方向对齐方式。fontsize, size:取值范围为浮点数或{'xx-small', 'x-small', 'small', 'medium', 'large', 'x-large', 'xx-large'},默认值为rcParams["figure.titlesize"] ('large'),文本的字体大小。fontweight, weight:取值范围详见文档,字即文本的字重。**kwargs:Text对象关键字属性,用于控制文本的外观属性,如字体、文本颜色等。
返回值为Text对象。
suptitle()相关rcParams为:
#figure.titlesize: large # size of the figure title (``Figure.suptitle()``)#figure.titleweight: normal # weight of the figure title案例
添加图像标题,并设置坐标、字体大小、文本颜色等属性。
import matplotlib.pyplot as pltplt.plot([1, 1])plt.title("title")plt.suptitle("suptitle", x=0.1, y=0.98, fontsize=16, color='red')plt.show()
上述就是小编为大家分享的如何在matplotlib中使用pyplot模块设置标题了,如果刚好有类似的疑惑,不妨参照上述分析进行理解。如果想知道更多相关知识,欢迎关注编程网行业资讯频道。
免责声明:
① 本站未注明“稿件来源”的信息均来自网络整理。其文字、图片和音视频稿件的所属权归原作者所有。本站收集整理出于非商业性的教育和科研之目的,并不意味着本站赞同其观点或证实其内容的真实性。仅作为临时的测试数据,供内部测试之用。本站并未授权任何人以任何方式主动获取本站任何信息。
② 本站未注明“稿件来源”的临时测试数据将在测试完成后最终做删除处理。有问题或投稿请发送至: 邮箱/279061341@qq.com QQ/279061341


